June 23, 2021 //
Blog // EN
The Battery Cycle #4: Charging batteries, food for minds
Below, a contribution from Claudius Jehle, CEO of volytica diagnostics GmbH. It’s the fourth of a series of knowledge articles (a cycle, indeed) on a series of topics around Li-Ion Batteries, written by Claudius and other field-related experts.
In our last article of the Battery Cycle series, we learned that we can picture batteries like bulbous wine decanters filled with foamy beer, which greatly helps to understand every day problems with SOC estimation, balancing problems and sudden standstills. But this analogy also greatly helps to understand typical questions around charging of batteries, which we will address in today’s 4th of 12 articles of the Battery Cycle.
It’ll be the place where to explain – among many other things – how and why doubling charging power cannot cut charging time half, at least if one intends to charge full.
Charging batteries, State of Charge
The peculiar “glass shape”* of Li ion batteries, with the most problematic ones being LFP and LTO, gives a hard time to any electronics and software to relate the filling height (voltage) to the filling content (SOC). The foaming component** on the filling height makes even the very measurement of this height a complex task, especially in dynamic situations. It comes natural that SOC determination is a complex task.
But let’s take a closer look at the foam – it can help to explain a lot more. Let’s start with depot charging setups, i.e. with busses with rather large batteries (150-350 kWh) that are meant to serve a route all day with no or only few top-up chargings. Typically, one wants the battery to be at 100% in the morning and to end with some reserve at the end of the day.
Depot charging: a wise choice?
But charging a battery to 100% before the day starts is not as straightforward as one might think. The charger first “negotiates” the upcoming charging process with the vehicle via some sort of dedicated communication protocol, involving an agreement on – first and foremost – the planned charging power that the charger is able to give, but also that the battery is capable of receiving! We limit ourselves to the battery part here, because one could write endless articles on this delicate and fragile communication part.

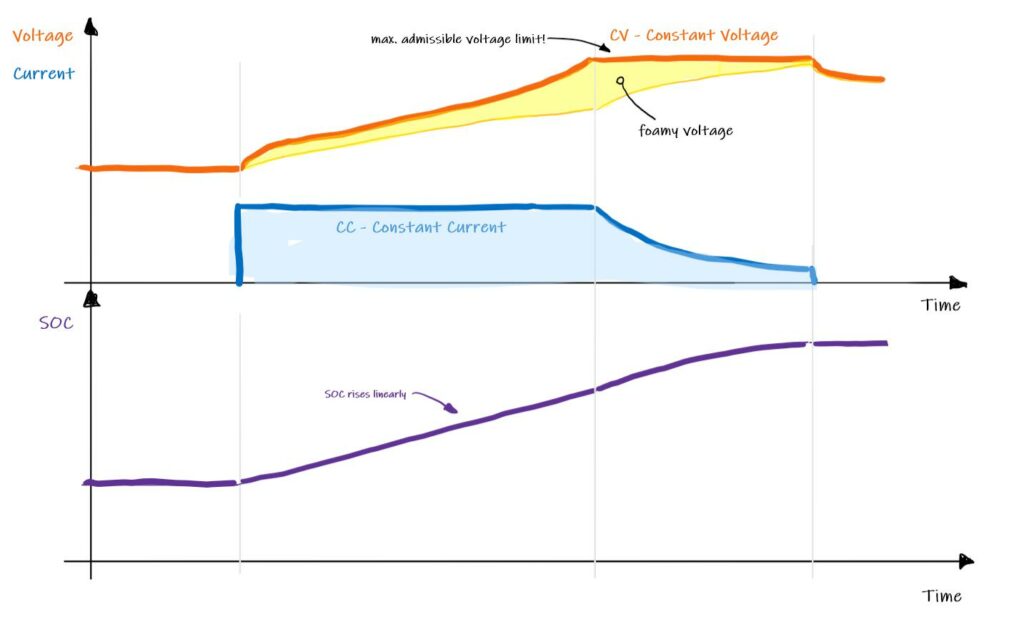
The charger now starts providing the agreed current in a constant flow – this phase is thus called constant current phase or simply CC phase. As the “glass” constantly fills up, also the filling height increases. The non-foamy liquid height increases depending on the glass shape, i.e. slowly in the “bulky” and faster in the narrow areas. And on top, the flow of current stirs up foam, the higher the current the more foam. Once total filling height approaches the top of the glass, i.e. the battery voltage reaches the absolute maximum admissible voltage, charger and battery quickly start renegotiating a new, smoothly changing current profile that keeps the total filling height just constant at the top – the constant voltage or CV phase. What in essence happens is that stepwise reducing the current will let the foamy party decrease, while the liquid part can continue to rise. This process in total is called CCCV charging.
Assume you would just stop charging completely when the voltage first hits the top – foam would settle and, somewhat surprisingly, you would find your glass only 85% full after some 10 to 30 minutes. So it is exactly like drafting a beer: CC beer flow until the foam hits the rim, then reduction of beer flow, keeping the total height constant (CV), only changing the liquid-to-foam ratio.

What are the implications? Look at the simulation results in the diagram – one straightforward consequence is that doubling charging power cannot cut charging time half, at least if one intends to charge full. As a matter of fact, the CC part is sped up, but also not by the factor 2, as the foam rises much faster, so the CV part becomes even more pronounced. In the example, there is even no CV part reached after ~900s (but it would come later!), but by doubling the power, CV is reached after ~570s, reducing the energy intake by 24%. Tripling the power obviously brings the system into CV right away (no CC observable), resulting in a less than double energy intake!
Learning? Fast charging: 3x charging power doesn’t reduce (full-)charging time by 3!
Simple – but it can be that the CV part takes just as long as the CC part. So to get the first 80% in can take just as long as to get the last 20% in! Observe it in your monitoring systems: first, SOC rises linearly, then it slowly decreases until it rests at 100%.
If you cannot observe this in your data when approaching 100%, the very likely reason is that the SOC that you see is not the actual, the “real” SOC. OEMs and manufacturers distinguish between the SOC that is communicated (often “customer SOC”) and the “real”, internally calculated one. The customer SOC is adapted to e.g. show 100% when the real is only at ~90%. Without going too much into detail, there are good reasons to do this: (a) to have some reserves (to accommodate the known estimation errors, cf. the last article), (b) to save the battery (too high/low SOCs are often detrimental to health) and (c) to emulate a seemingly uniform behavior over the whole lifetime by unlocking the reserves over the lifetime. So, looking at (c), if you do not observe this charging behavior now, you might well observe it later – bear in mind that the depot charging time of the vehicle might increase in the future!
Charging batteries: what about opportunity charging?
With opportunity charging, there are other challenges. One typically does not charge to 100% (only in the morning, see above), but repeatedly top up a smaller battery (50-150kWh). The foam never hits the rim, so no tenacious CV phase, only CC. But to further speed up the charging breaks, the charging power is typically very high. So although there is no CV part that could “choke” the fast charging, the high pulses can result in resistance-induced voltage spikes (here the glass & liquid analogy fails a bit – maybe think of sparkling wine: you pour it in, the foam extremely quickly rises very high and decays in virtually only seconds). As the resistance increases due to degradation, these spikes increase likewise. Take-away message: Opportunity charging has beneficial characteristics, at least charging time wise, but can suffer from degradation induced charging time increases.
Finally: inductive charging…
One remark on inductive charging, although it has nothing to do with the battery technology. It’s a fabulous idea, as there would be virtually not positioning efforts anymore and one could even charge while driving. But as always, physics kick in. The ratio of energy that reaches the vehicle vs. that is lost due to peculiar induction inefficiencies – plainly: that is converted into heating the environment – depends on mainly 2 factors: (a) the distance between the receiver and the sender and (b) the frequency of the alternating electro-magnetical induction field.
For inductive charging not to become uneconomically unbearable, you either have to (a) reduce the distance between sender/receiver to only millimeters and/or (b) increase the frequency and thus coil size and thus weight. Ideally you have a several hundred kilogram copper coil flexibly suspended (equally!) millimeters away from the sender. These very competing requirements however have repeatedly proven to be uneconomically unbearable. A pity!
Charging batteries, take home messages
- There is often a customer SOC that is a little different to the real SOC, entailing some reserves
- In depot charging applications or anywhere, where a battery is charged to 100% (really 100%), some form of CCCV charging is employed
- The peculiar pattern of CCCV leads to the weird behavior that doubling or tripling charging power does not cut the time half/by three
- Increasing charging power by X doesn’t necessarily cut charging time by X!
- Opportunity charging is mostly CC and is thus not susceptible to this pattern, but is susceptible to rising resistances due to degradation
- Inductive charging (which is not a 3rd option, just a technology, so there could be inductive opportunity charging) would be nice, but is technologically extremely challenging
We encourage everybody to openly discuss the options and implications of different charging philosophies with their OEM partners. It is very helpful to ask for maximum transparency in the basic battery & charger signals and even for periodic information about the degradation, as we already now learned now how degradation affects every aspect of a battery.
* i.e. OCV characteristics
** i.e. the overpotential/dynamic voltages
*** Simulation (LFP, SOC0=50%, 30°C env) results from: Bunzel, A.; Morawietz, L.; Ufert, M.: Technologische und ökonomische Bewertung der Elektrifizierung von ÖPNV-Busflotten im Werkstatt- und Betriebshofbereich. Fachtagung „Werkstatt- und Betriebshofkonzepte für Elektrobusse“, Dresden, 11.-12.10.2018.
First published on Sustainable BUS